Probability Tree Diagram
This note deals with the relationship between the intuitive approach to conditional probability being tree diagrams, and how this intuition relates to bayes' theorem and the law of total probability.
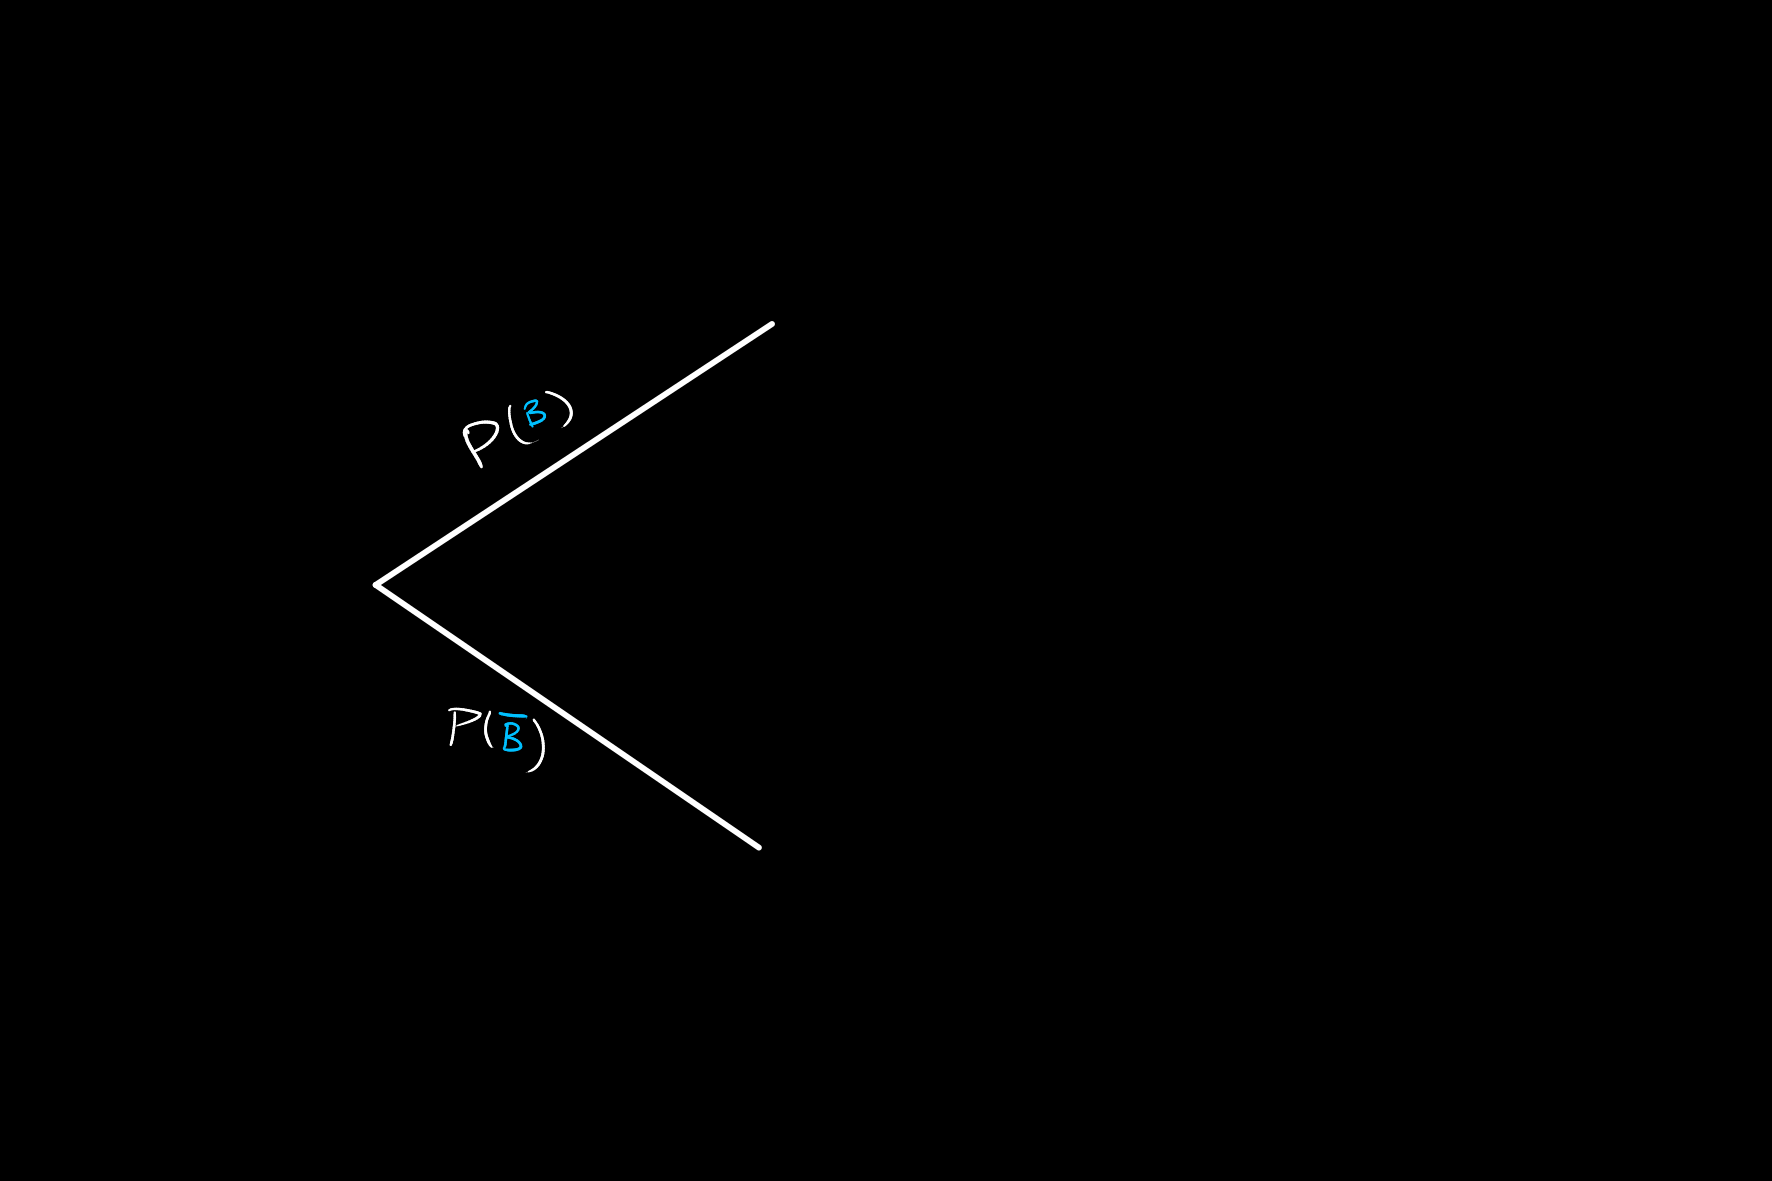
Consider events
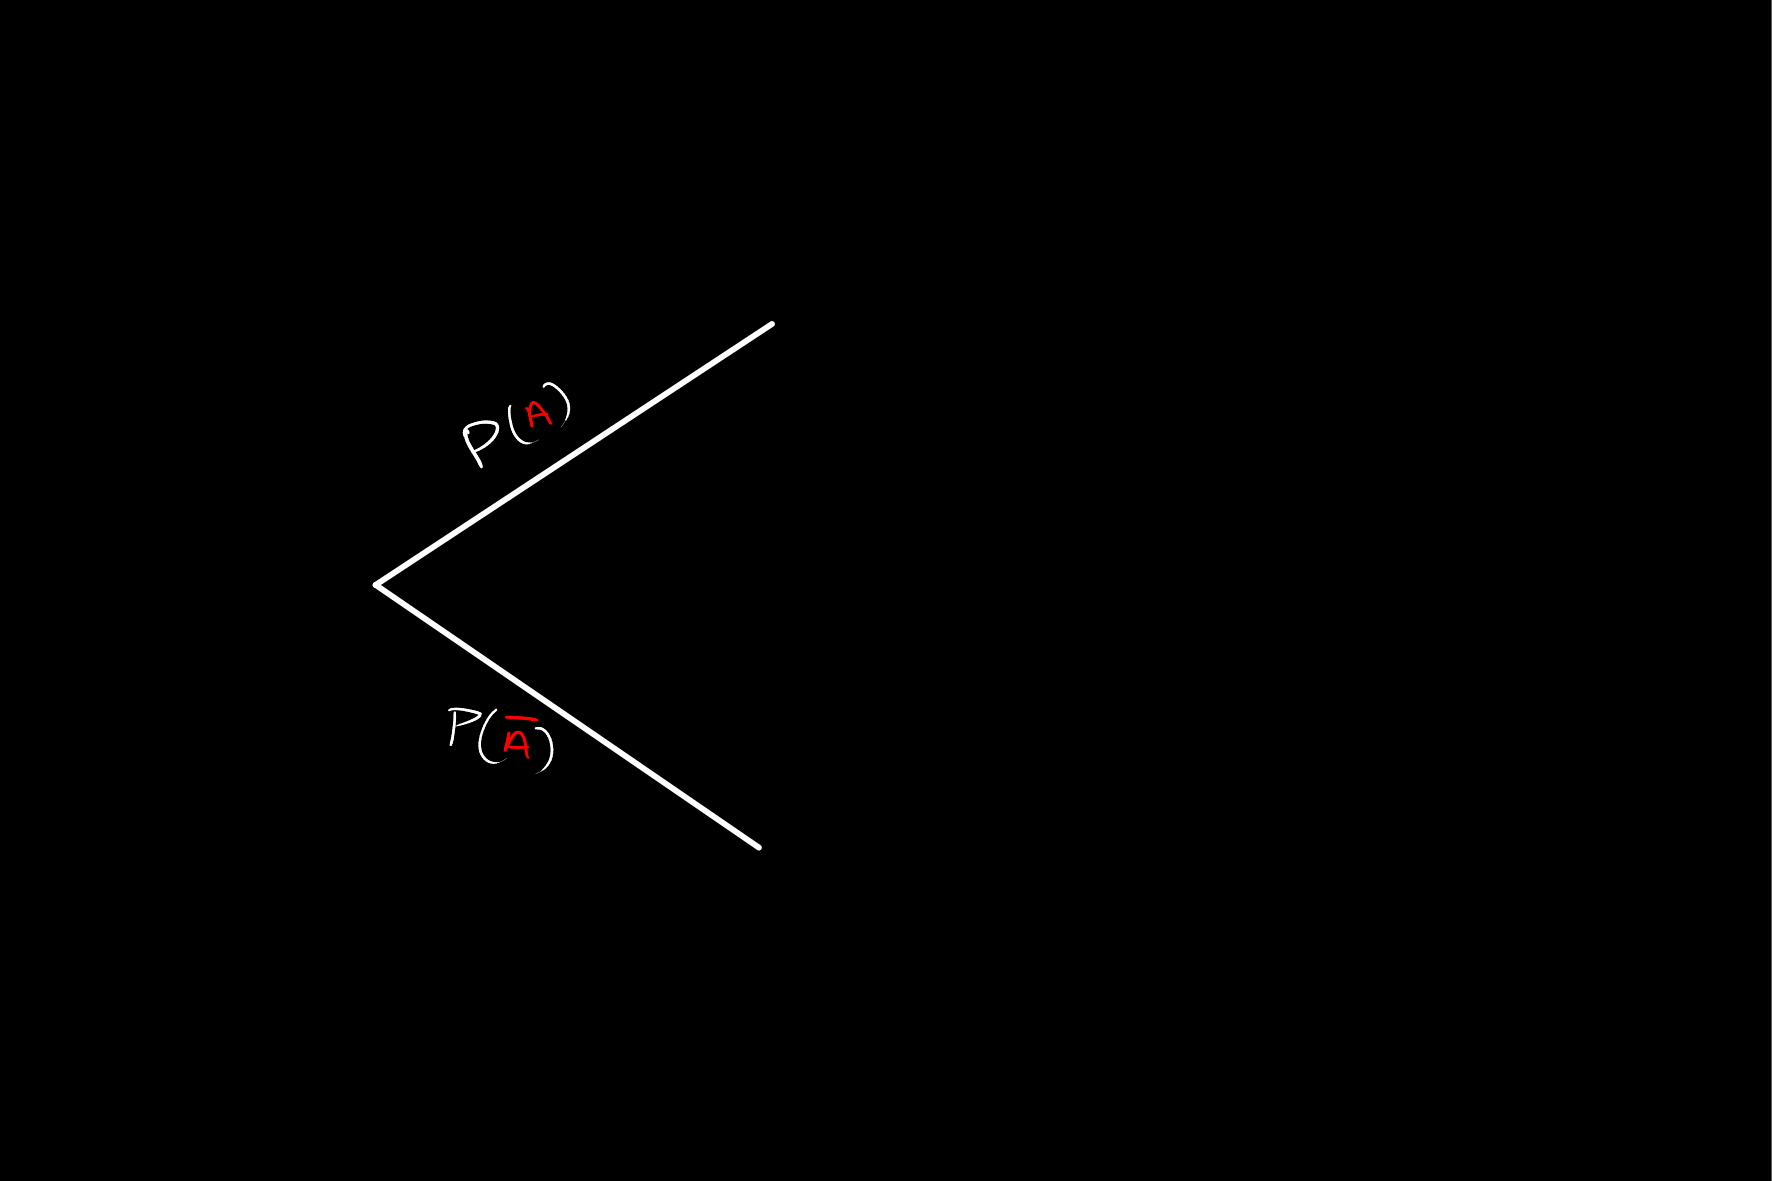
Now, in each of these cases we have two possible states for event
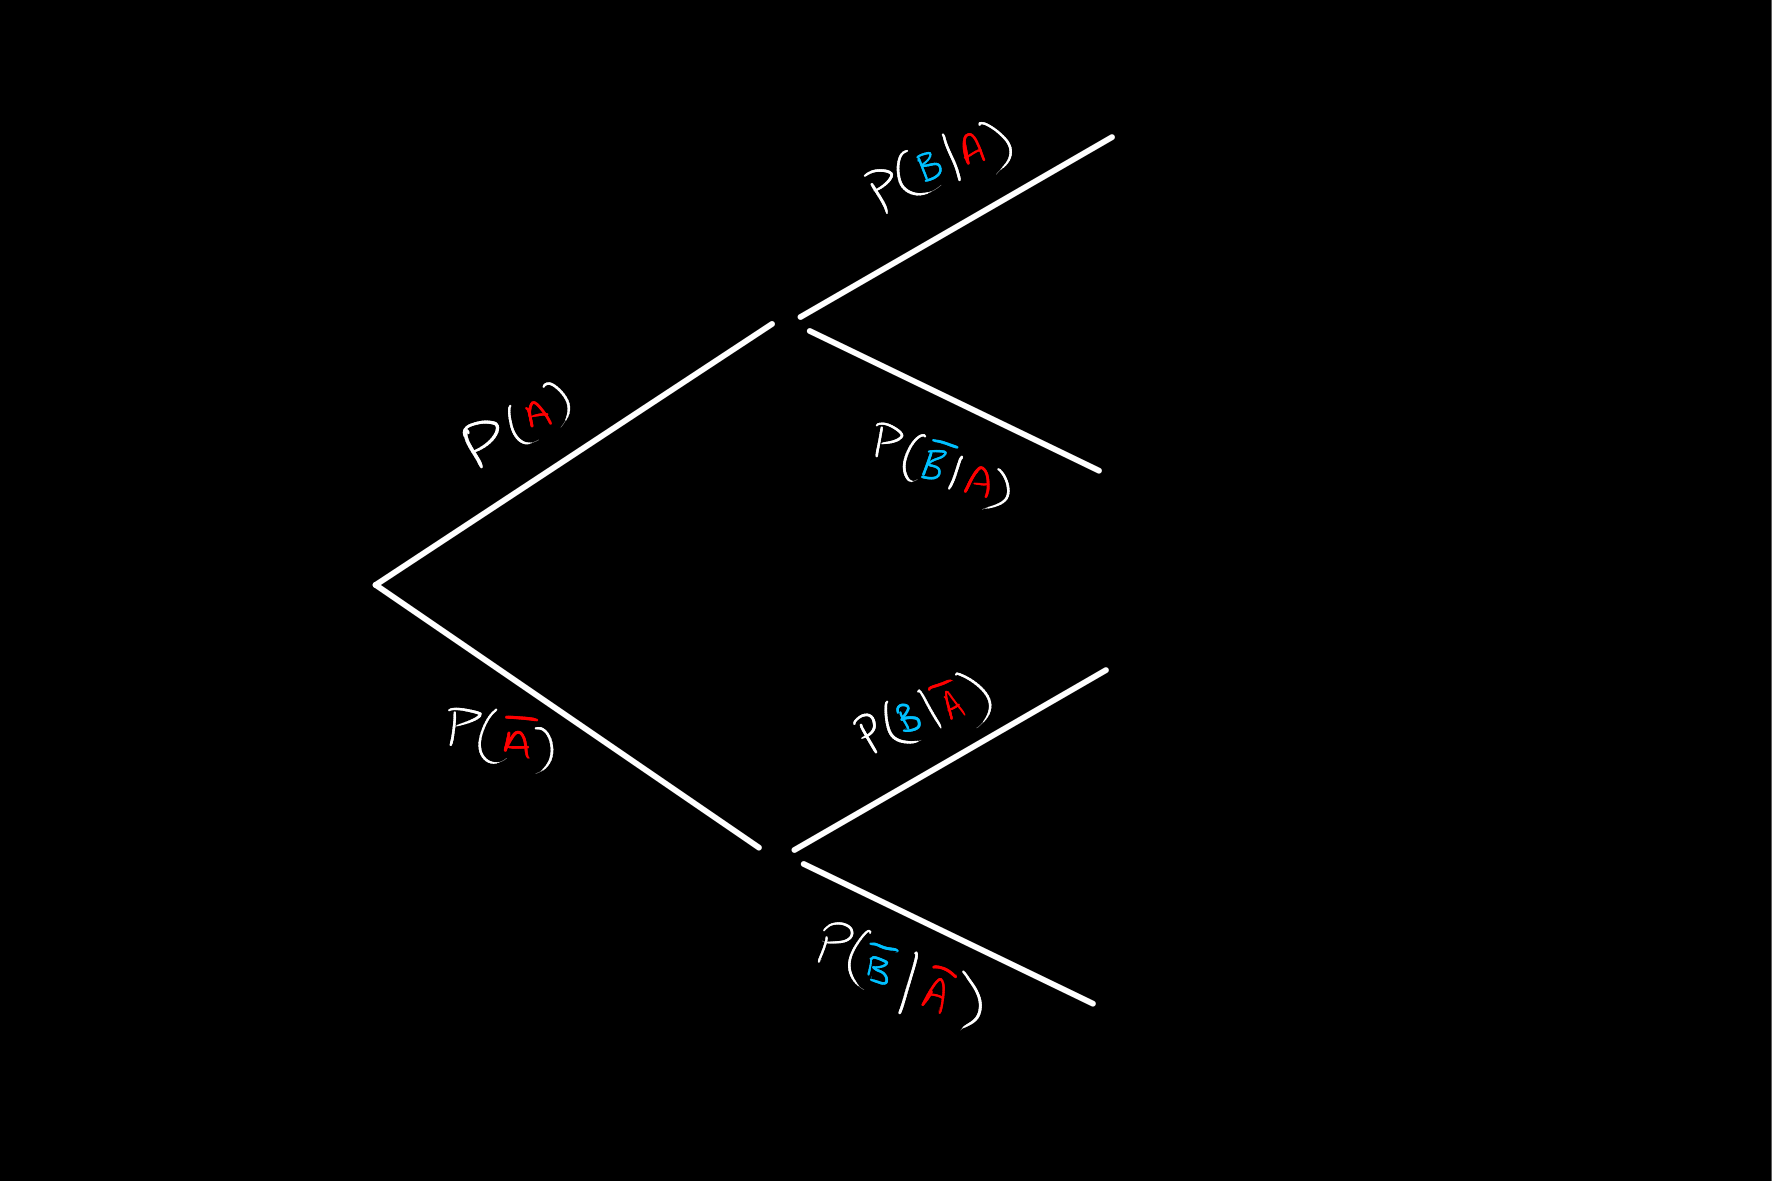
This then gives all possible states for
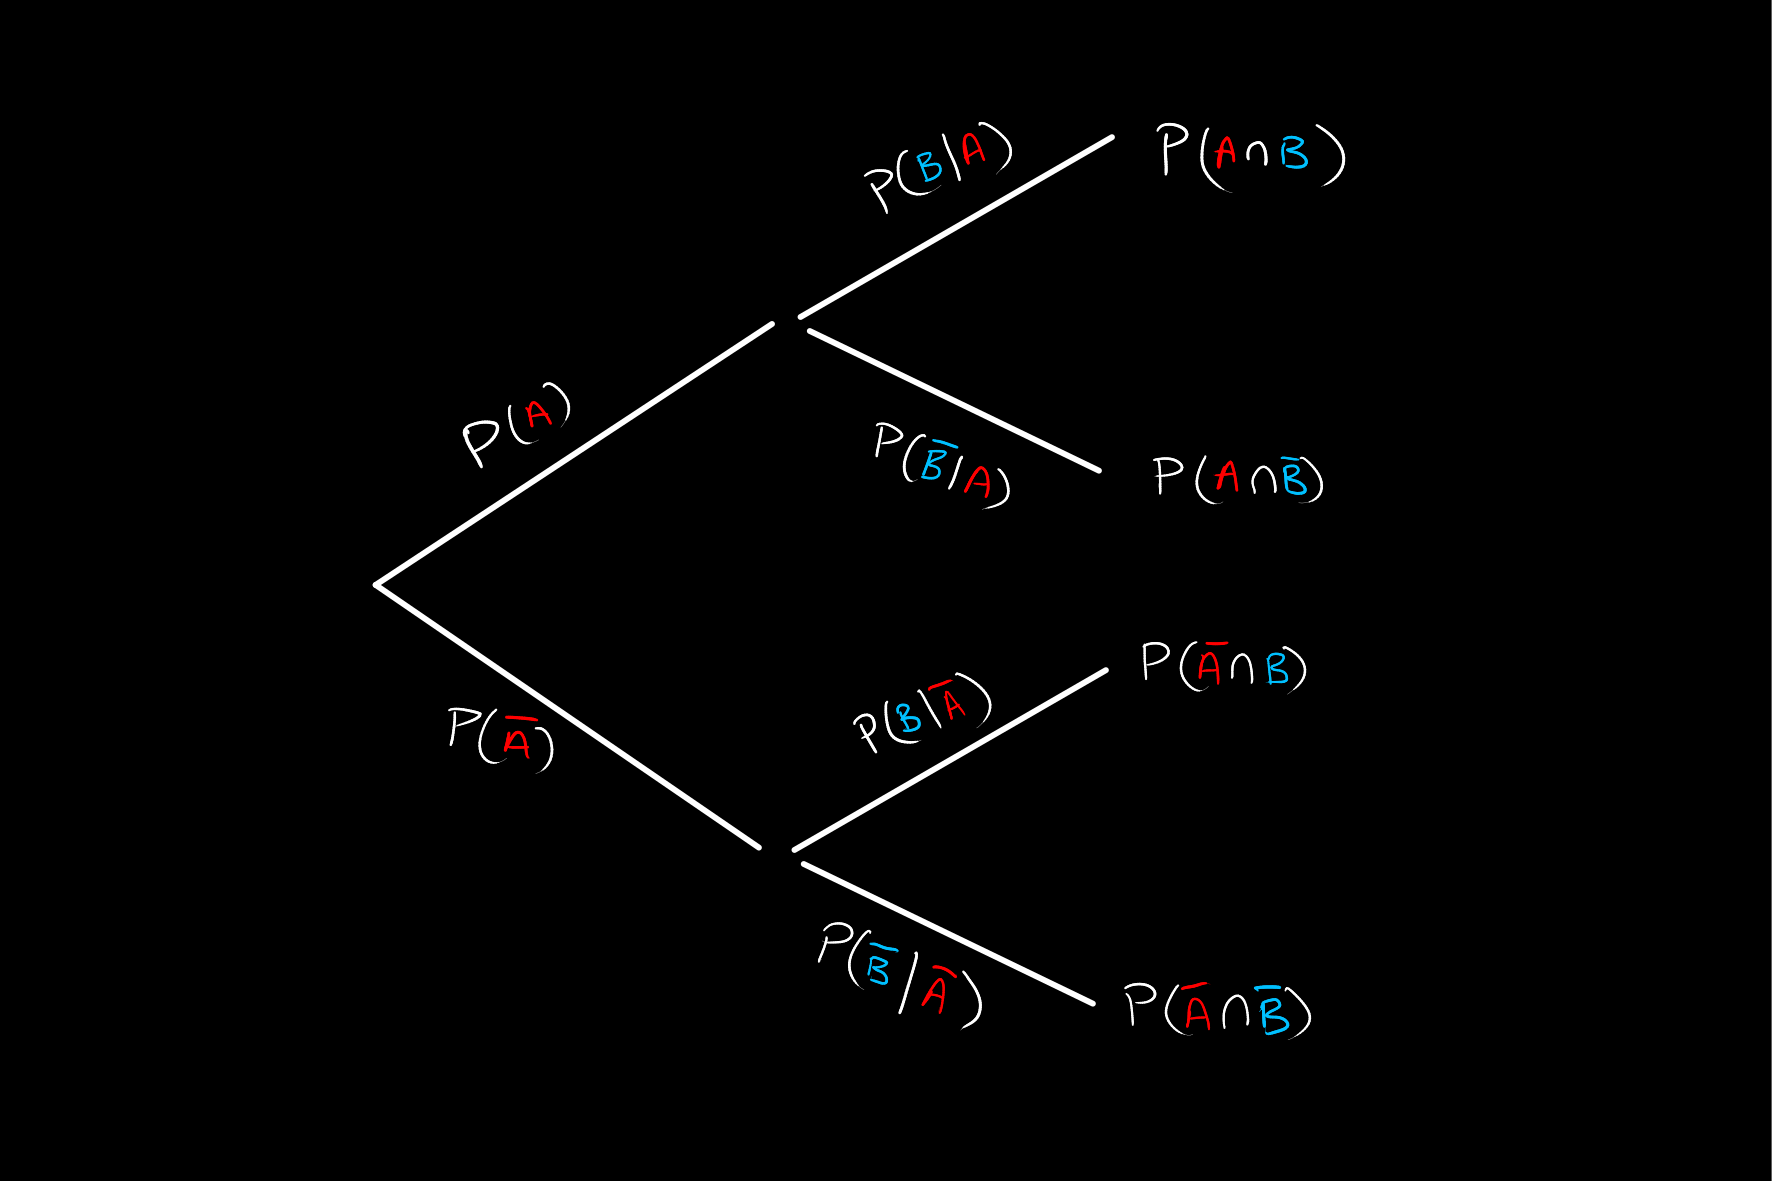
Now that this tree diagram has been drawn out, we may use to calculate other probabilities not listed here. The first useful thing to know would be the probability of
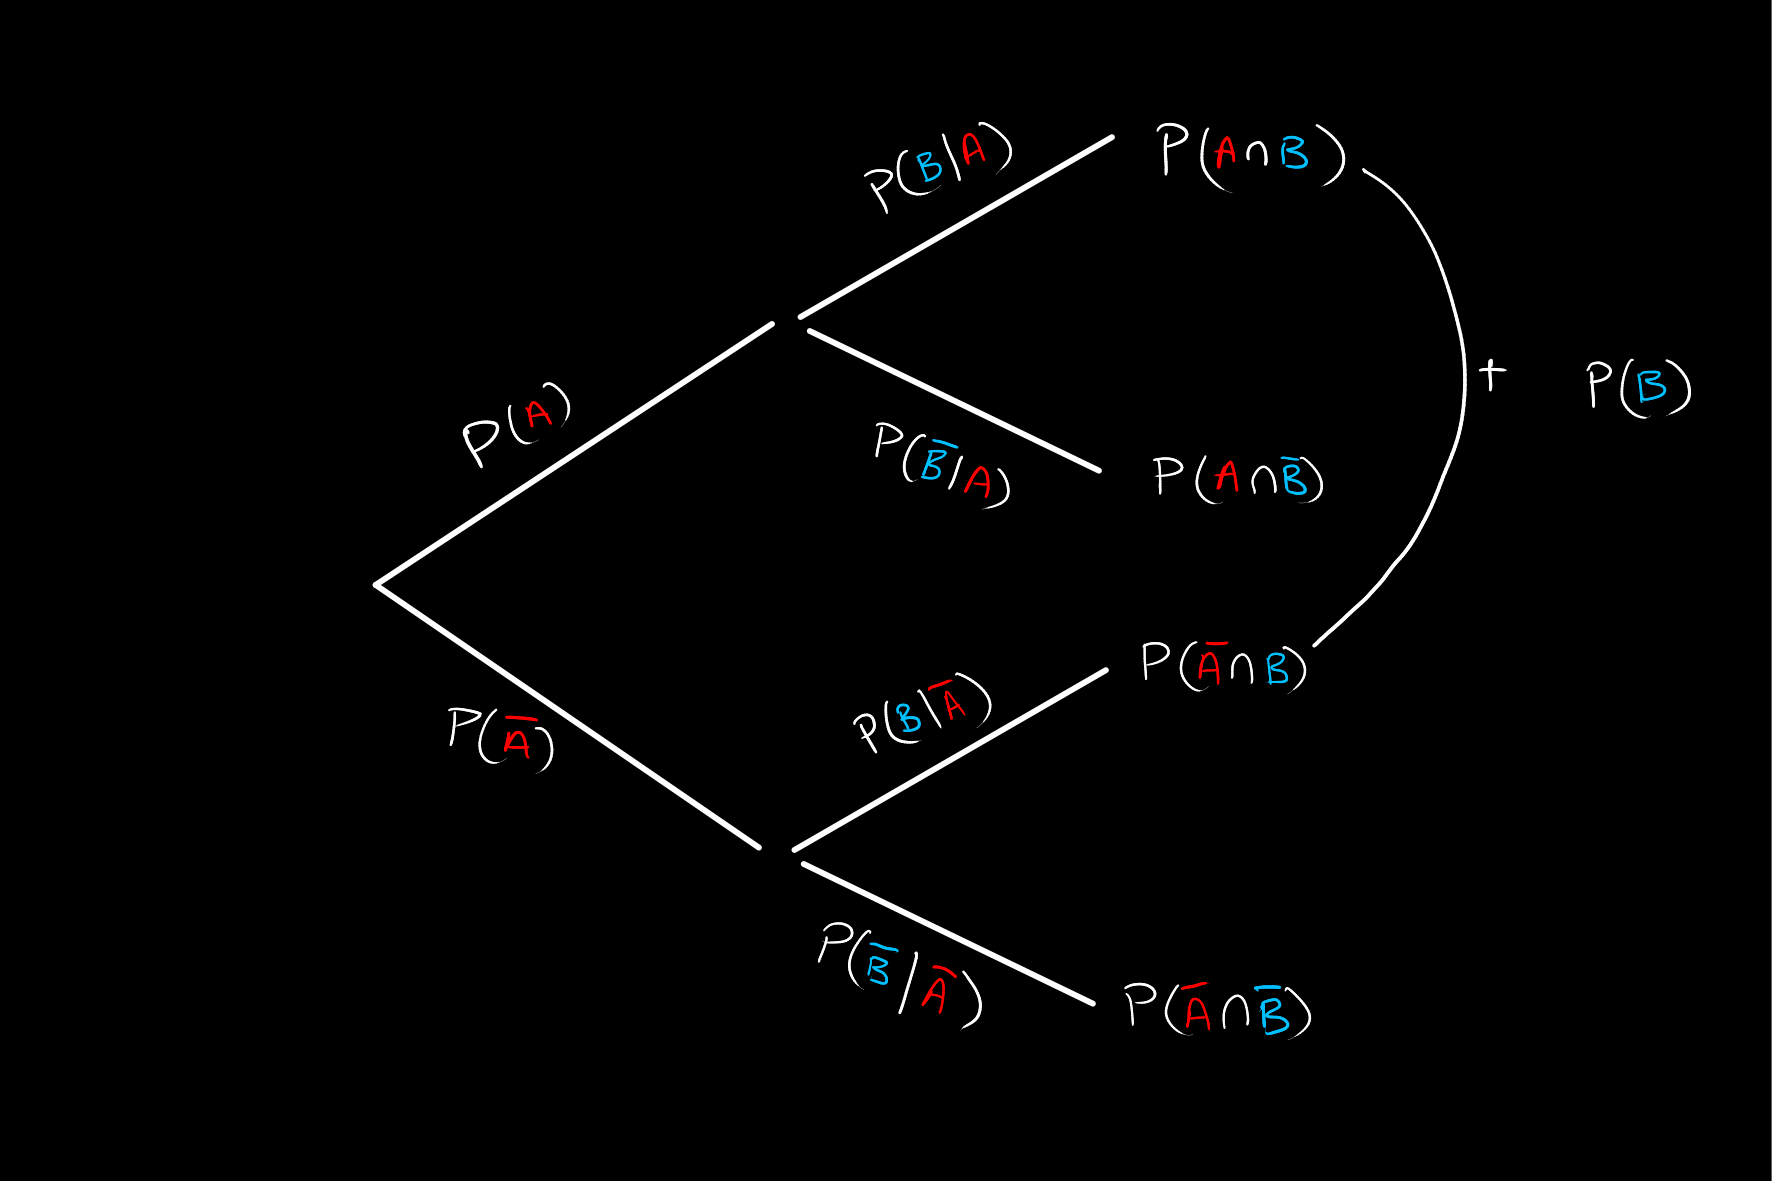
We may do this given that all four cases at the end are mutually exclusive.
This addition is just an application of the law of total probability. That is, we are calculating:
The other useful probabilities we may wish to know are the probabilities of
The remaining probabilities we need to complete this diagram follow from Baye's theorem. For example, on the first branch we need:
where
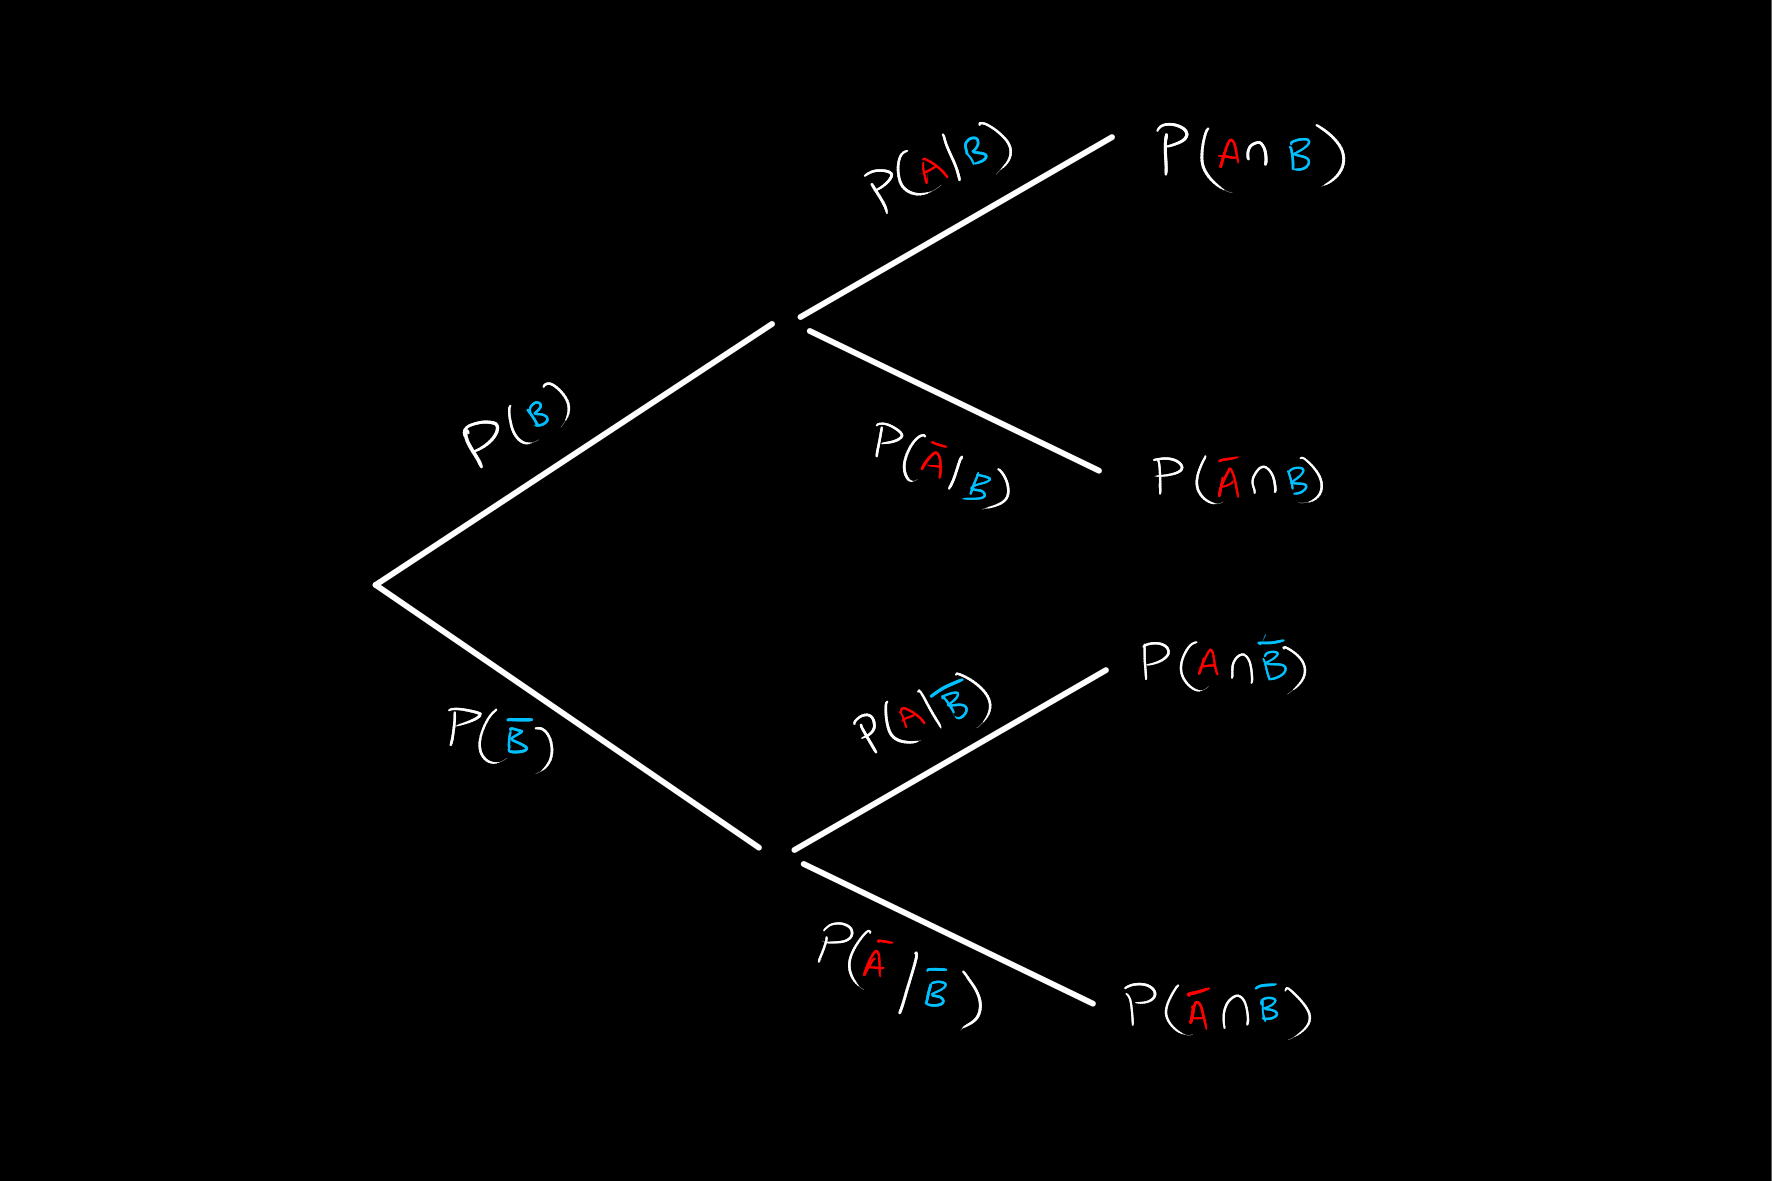
noting that the probabilities on the far right are just a permutation of those we had on the first tree diagram.